

What is the Media Planning Tool?
The Media Planning Tool helps you assess the impact of Onsite Display campaigns by providing an estimate of the available inventory on a retailer’s site during a selected timeframe (up to 120 days ahead). The tool uses booked inventory and seasonal data to generate an estimated budget, impression volume, and average CPM for the selected inventory, allowing you to plan upcoming Onsite Display campaigns more accurately.
The following parameters are considered by the Media Planning Tool when generating a forecast:
Budget
Duration
Frequency capping
Advanced targeting:
Store ID
Add to Cart
Custom Audiences
Retailer CPMs (more than one may exist for the selected categories)
Historical impression data (how much traffic has historically occurred during the selected timeframe)
Why use the Media Planning Tool?
Use the Media Planning Tool to confidently plan and scope your Onsite Display campaigns. It helps you:
Forecast available inventory: Understand how many impressions and placements are available on a retailer’s site up to 120 days ahead.
Estimate campaign budget: Get an estimated total budget and average CPM based on your selected parameters, retailer rates, and page types.
Plan smarter with data: Leverage historical impression data and seasonal traffic patterns to align your campaign with peak performance windows.
Test scenarios in advance: Compare performance expectations across different durations, placements, and targeting options before submitting proposals.
Who is it for?
It is designed for users responsible for planning and scoping Onsite Display campaigns.
When to use it?
Use the Media Planning Tool when you:
Need to estimate available Onsite Display inventory up to 120 days in advance.
Want to forecast impression volume, average CPM, and estimated budget for planning purposes.
Are preparing a campaign proposal for a retailer and need data-driven support.
Want to validate inventory availability before submitting a display campaign.
Need to compare forecast results across different timeframes, page types, or targeting setups.
Where to find it?
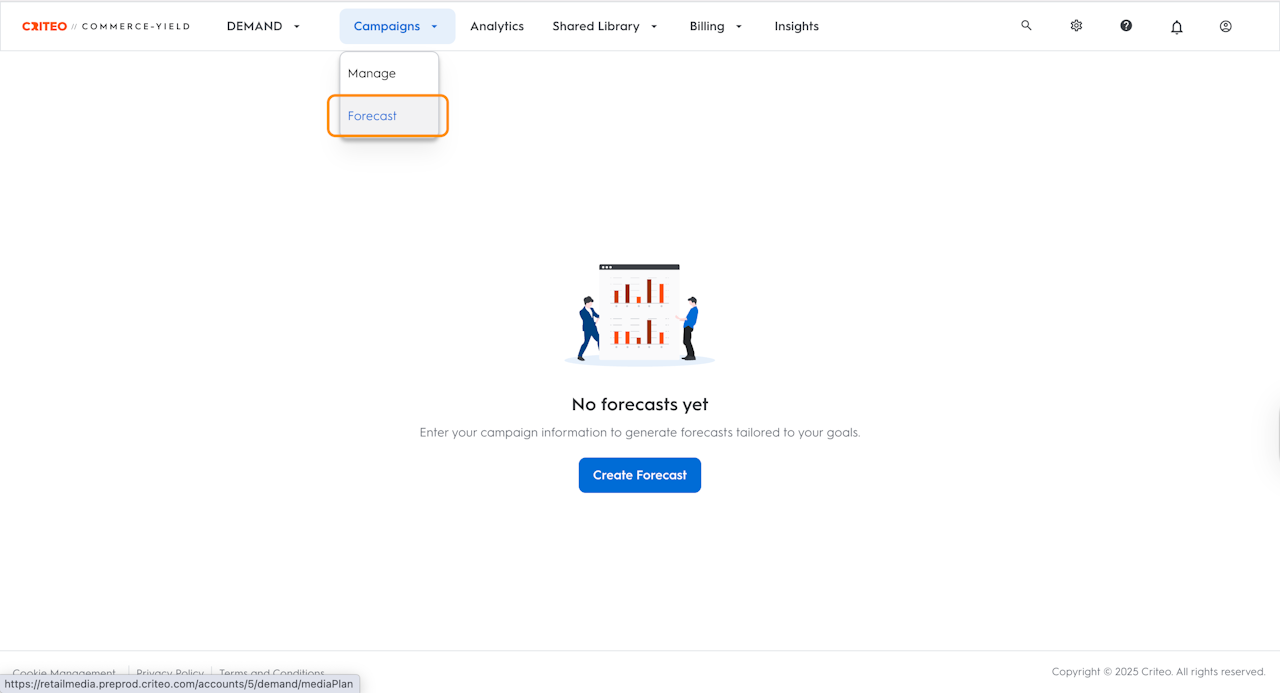
To access the Media Planning tool, select Forecast from the dropdown under the Campaigns tab in the top Navigation Bar.
Creating a Forecast
In this section, you will learn how to create a Forecast in the Demand side of your supply account. Follow the steps.
To create a forecast, select Forecast from the dropdown under the Campaigns tab at the top navigation bar.
Click on the Create Forecast button to launch a pane on the right side of the dashboard.
Choose your Buy type. You can choose from:
Auction
Preferred deals
Select the Start and End dates for the period you’d like to forecast for.
Set your Frequency capping.
Select the Page Type Targeting.
To target a more specific group of shoppers, you can select from the following Advanced Targeting options:
Add to cart
Store IDs
Select audiences
Set your Bid (CPM).
Click Create Forecast to generate your forecast.

Navigating the Forecast Page
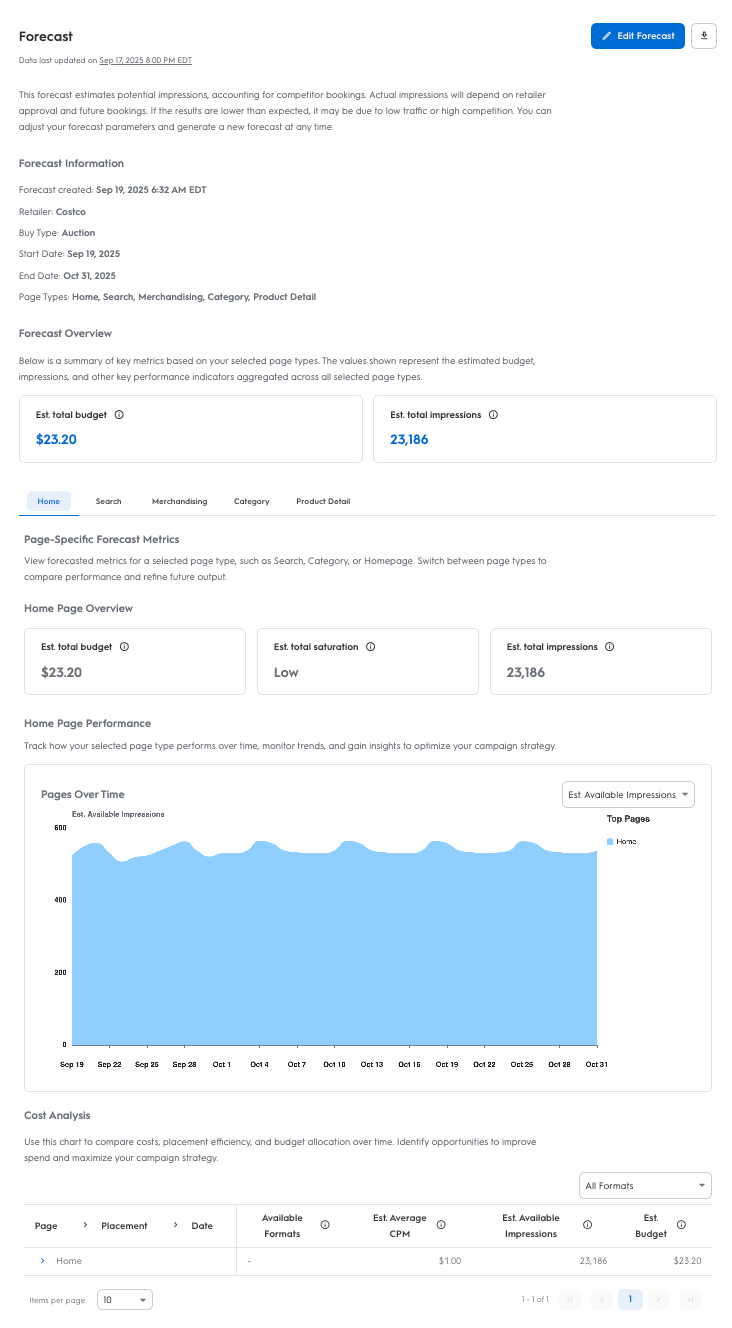
On the Forecast Page, you can find the Estimated Total Budget, Estimated Average CPM, and Estimated Total Available Impressions, along with a day-over-day visualization of available impressions broken out by the pages included in your forecast. Any fees appended to the account will be applied to the Estimated Budget and Estimated Average CPM. However, once you have generated your forecast, there are several ways to adjust your view for additional details.
In this section, learn how to adjust your forecast view to access additional details.
Use the Edit Forecast button in the top right of the page to adjust the retailer, start and end dates, and inventory you’d like to generate a forecast for.
The dropdown in the Pages over Time graph allows you to toggle between Estimated Impressions and Estimated Budget
The data table below the graph displays a more granular view, breaking out the available inventory by page, placement, date, and available formats. You can click the name of the Page to show available formats for that page and click the name of each format to display data by day.
Auction forecasts will display a Saturation Rate for each page included in the forecast, indicating how booked each page is and the level of auction competition expected. The rate is displayed as High, Medium, or Low in the metrics at the bottom of the forecast page.
Use the dropdown above the data table to filter the information by a specific format
Download the report in Excel or CSV using the icon in the top right corner of the dashboard.
